
Yale Center for Emotional Intelligence
Mood Meter - How you feel?
Mood Meter is part of the RULER web app used for training of teachers and school staff. It helps with implementation of emotional intelligence principles in their schools.
My role was to research, design and test all UIs related to the project. I collaborated with development team and project manager to launch this project.
UX/UI design,
HTML/CSS Prototyping
Defining the Problem
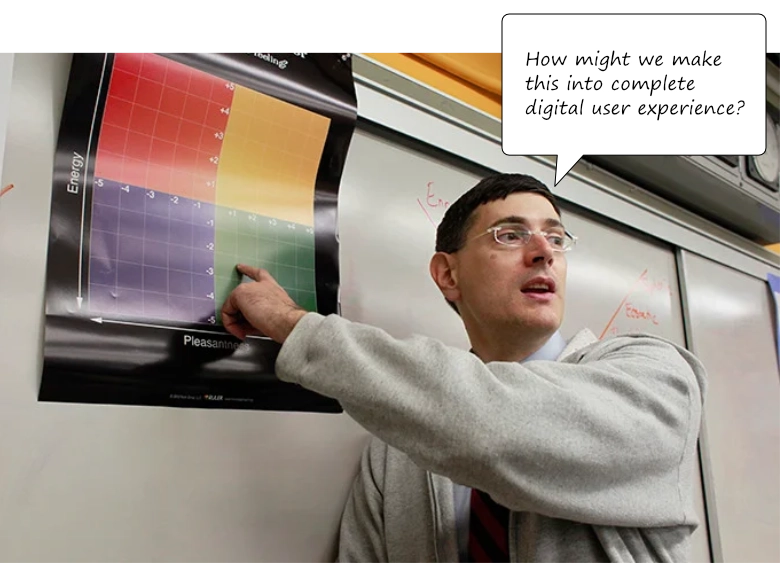
The Mood Meter is one of the “anchors of Emotional Intelligence” in the RULER program. It helps people develop the core RULER skills: Recognizing, Understanding, Labeling, Expressing, and Regulating emotions.
Many people struggle with identifying and managing their emotions, which can impact their personal well-being, relationships, and overall quality of life. Learning to identify and label emotions is a critical step toward cultivating emotional intelligence. The Mood Meter addresses this issue by providing a visual and interactive tool to help users pinpoint and categorize their emotions accurately.
Starting with Questions
We created a list of "How Might We…" questions to help us better align our user’s tasks and goals:
- How might we enable users to easily plot their mood?
- How might we provide a way user to track their moods and emotions through time?
- How might we allow them to track their emotions in groups (i.e., in classroom)?
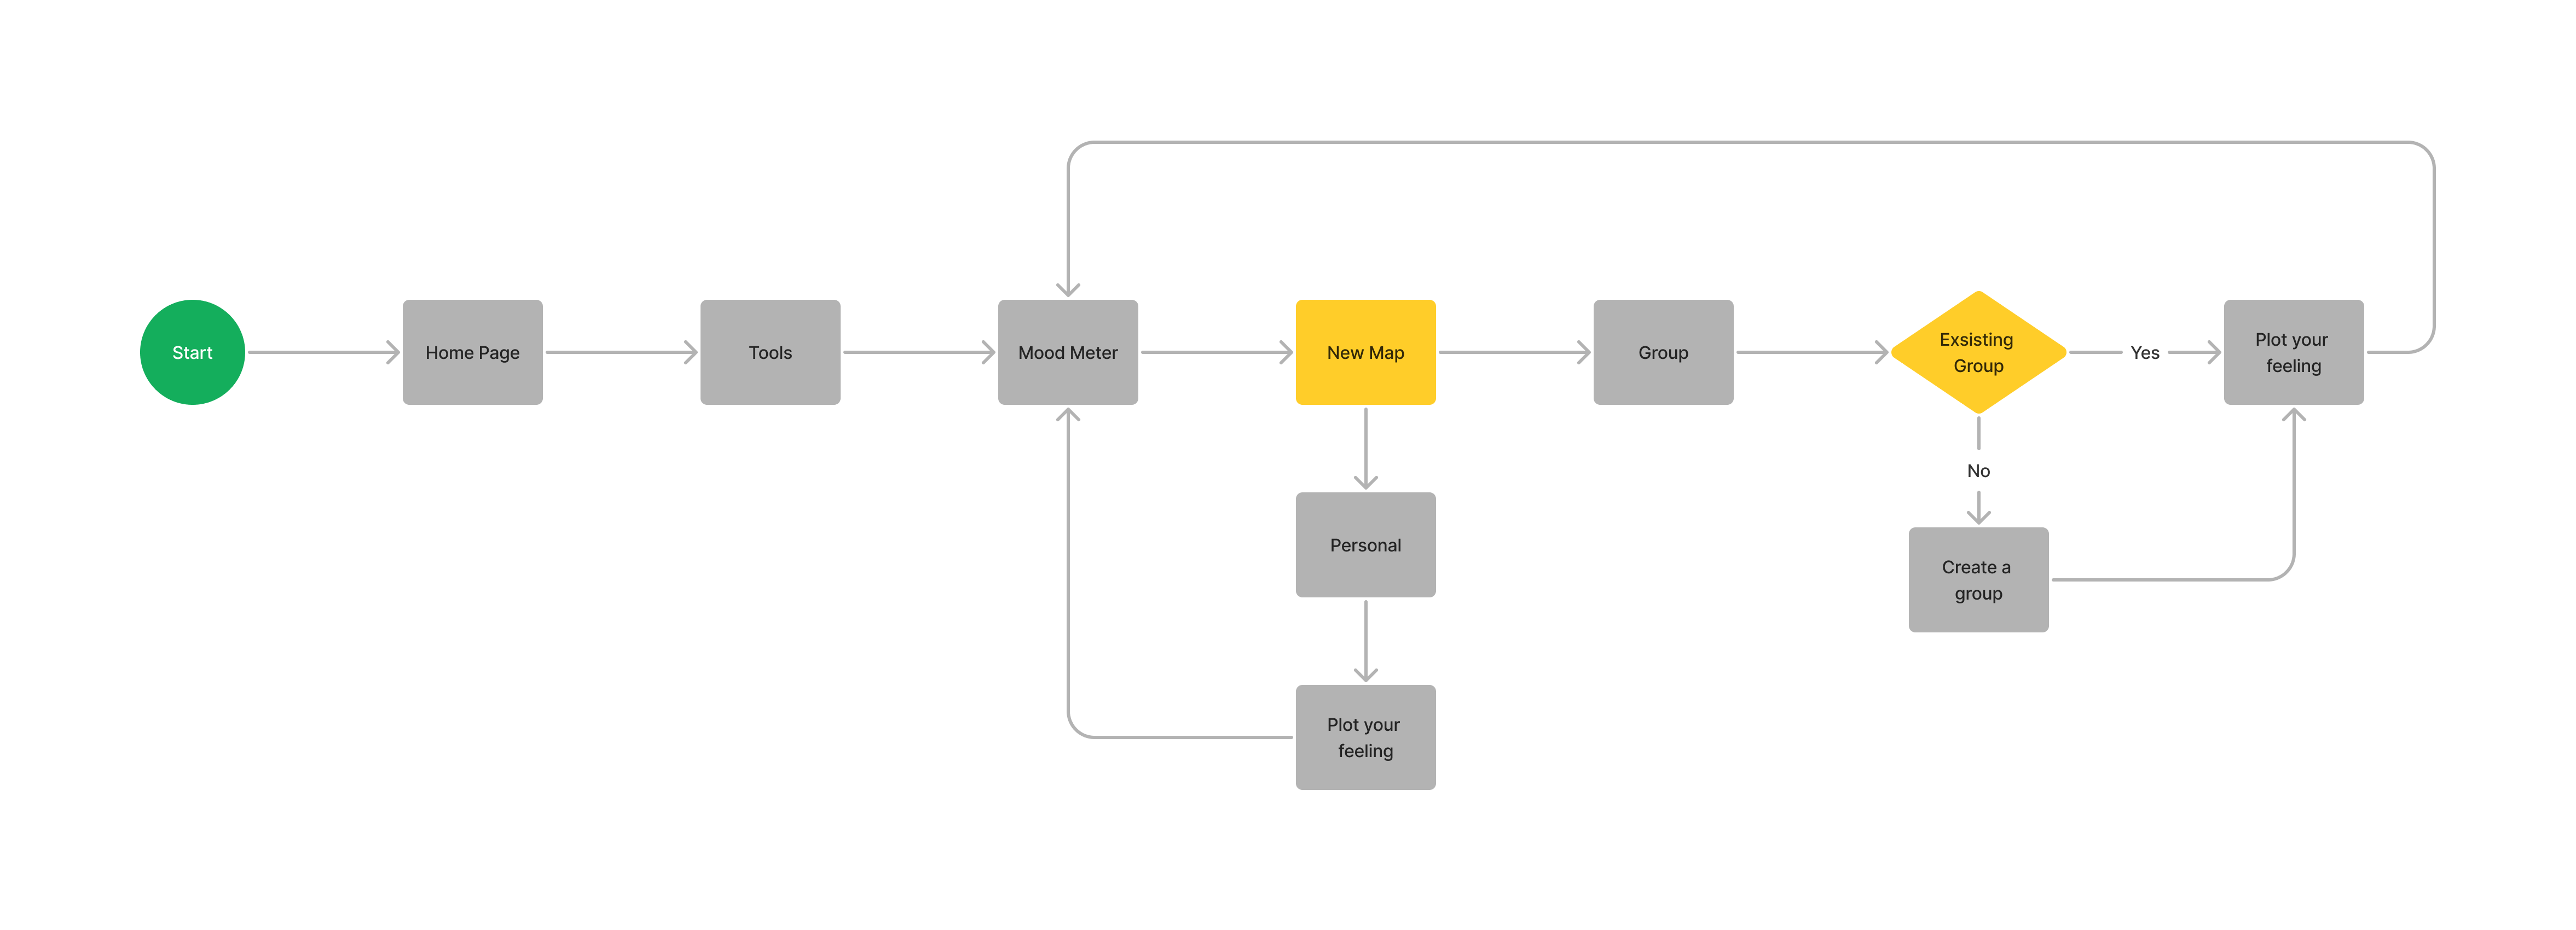
After the initial brainstorming session with the team, we created a user flow to display the necessary steps users should take to plot their mood.
First Attempt
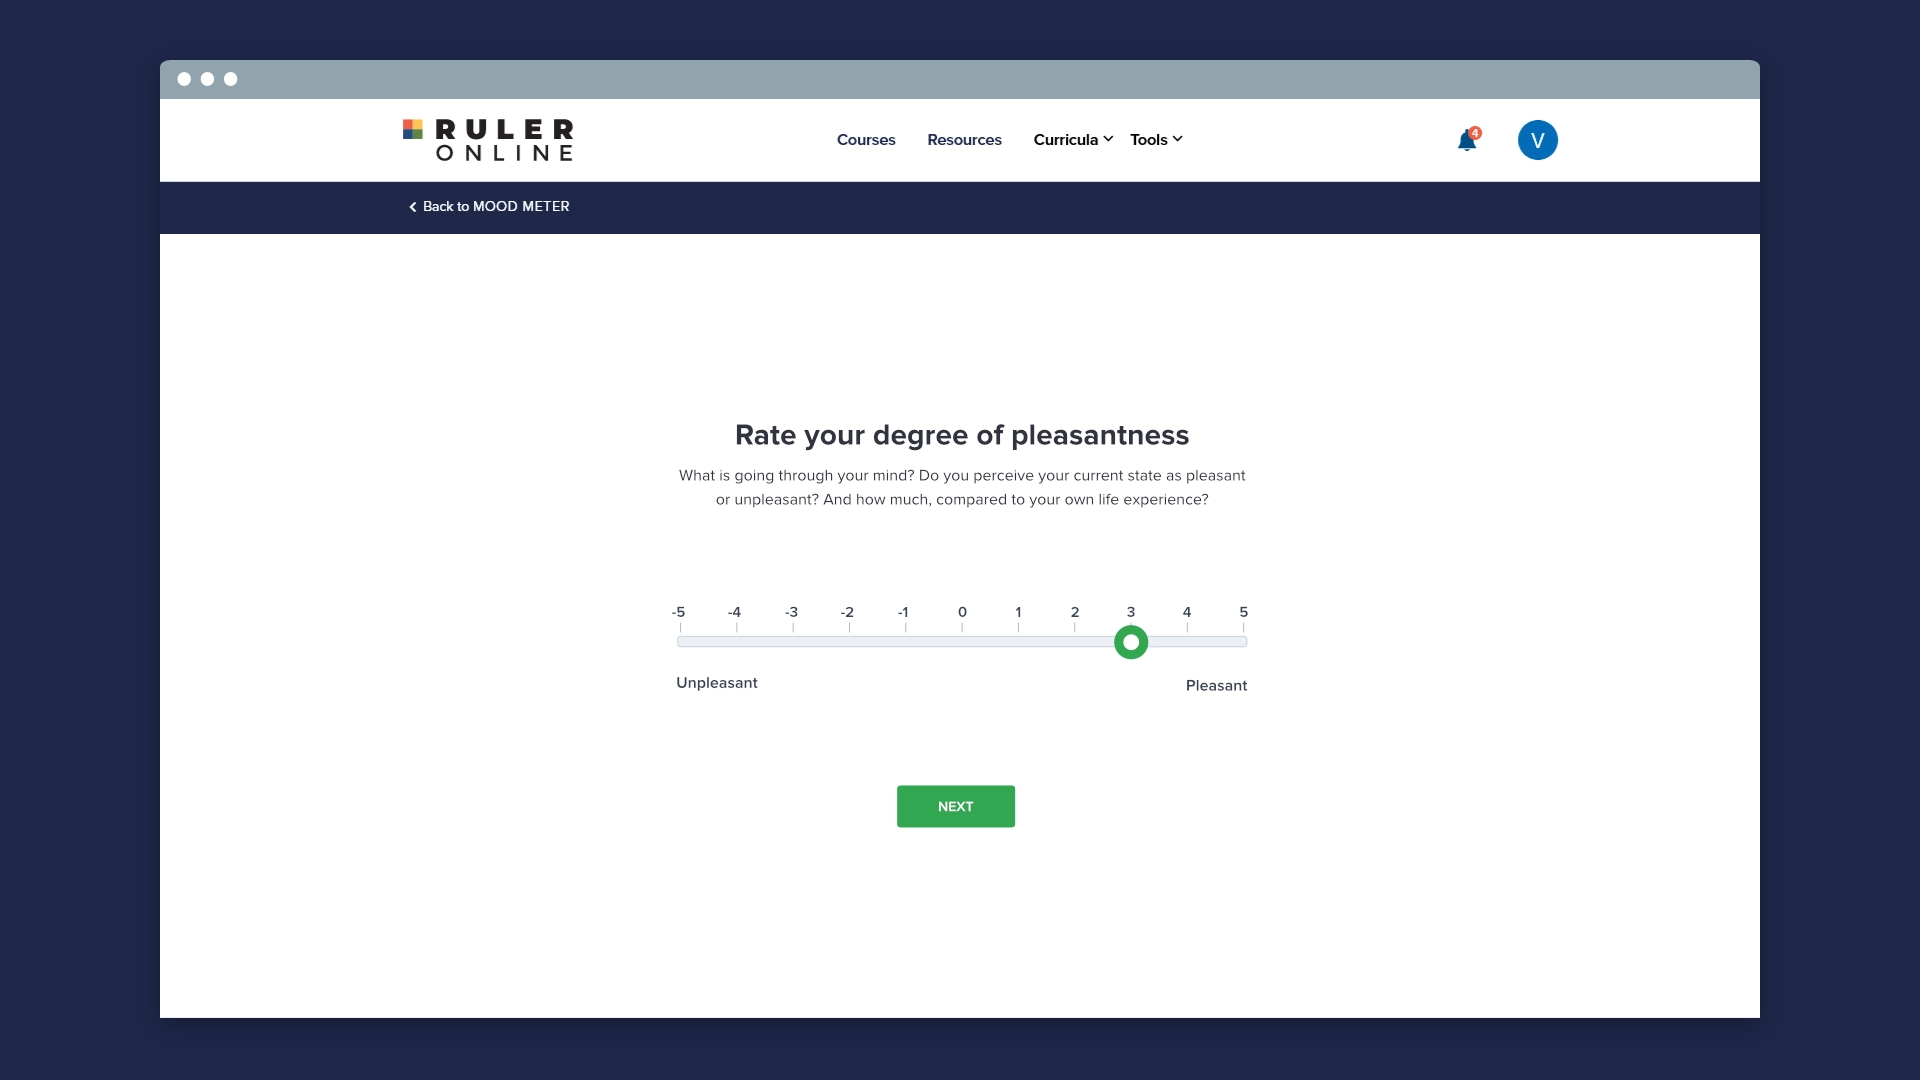
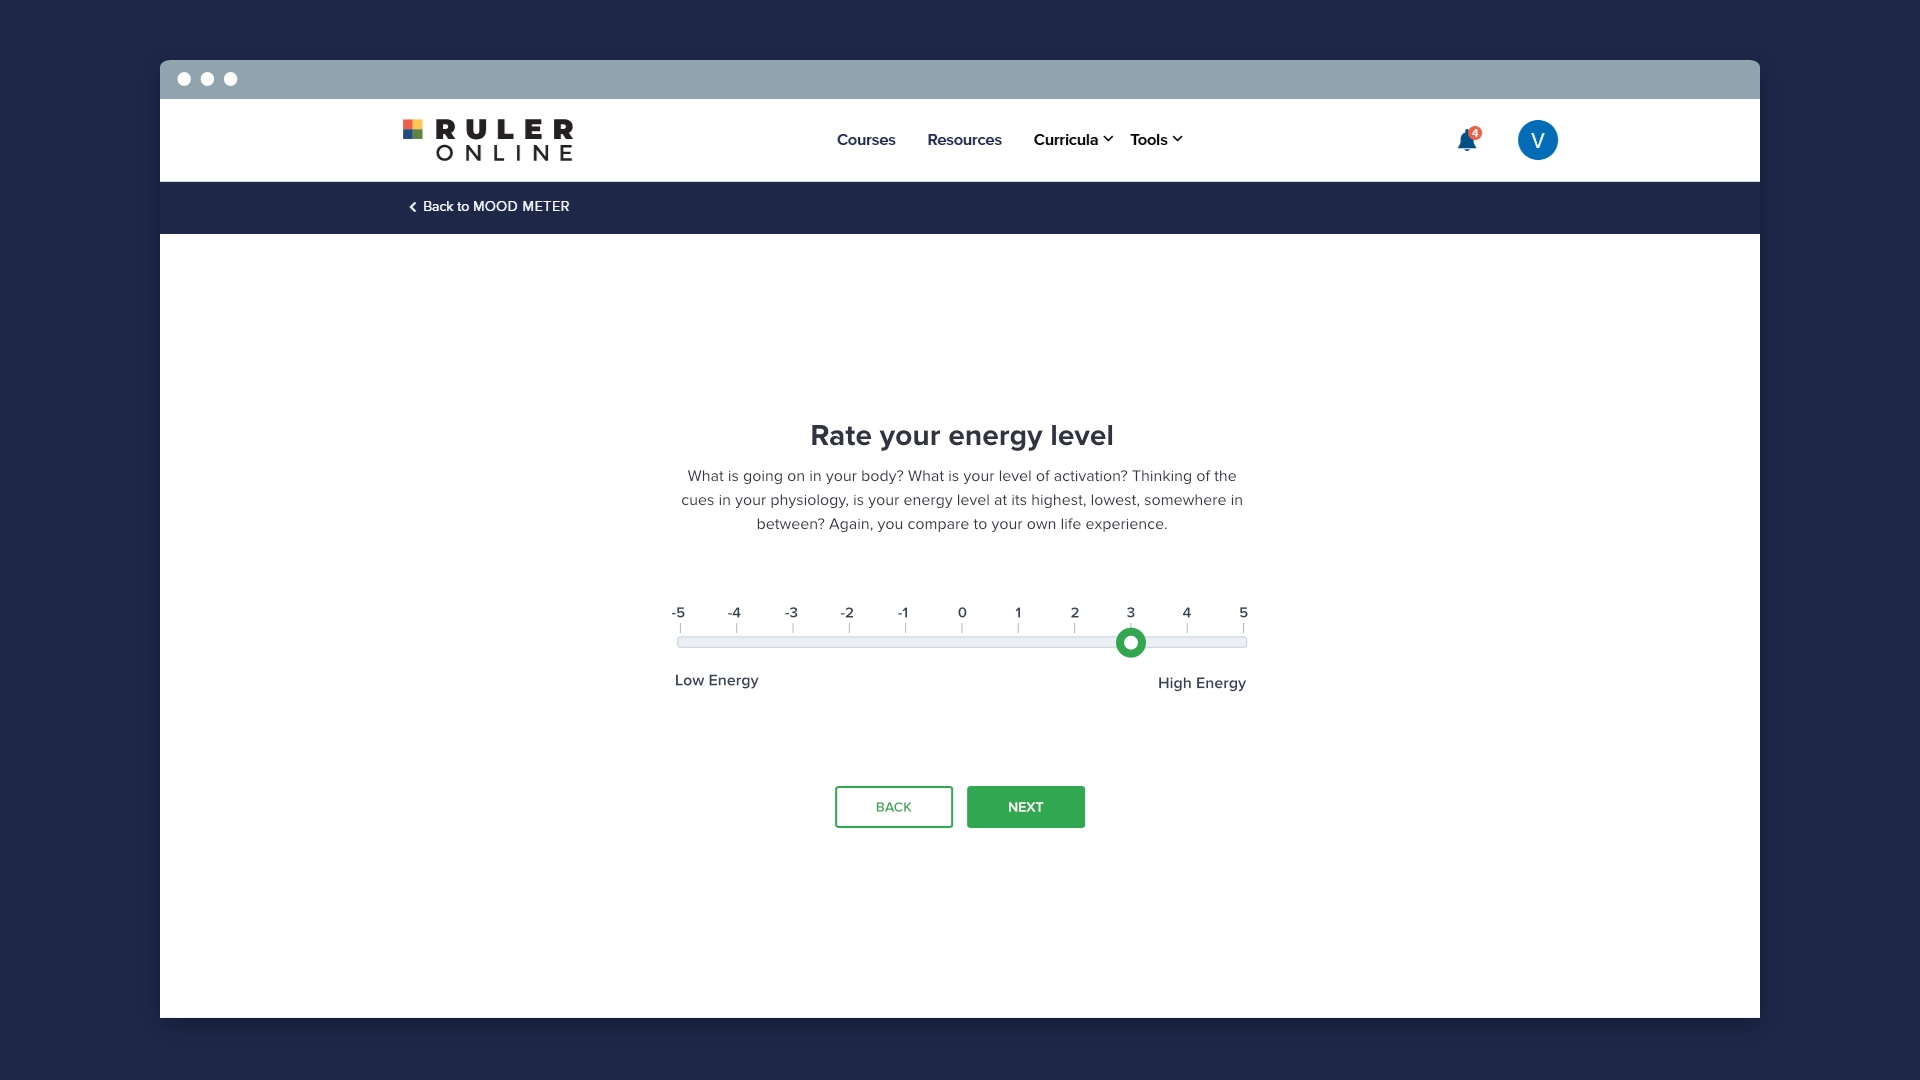
The first attempt to design the mood meter was to make the plotting experience like step process. After testing the prototype with five users, I realized that although the solution is easier to use, the participants couldn't connect "pleasantness"/"energy" sliders with the mood meter chart.
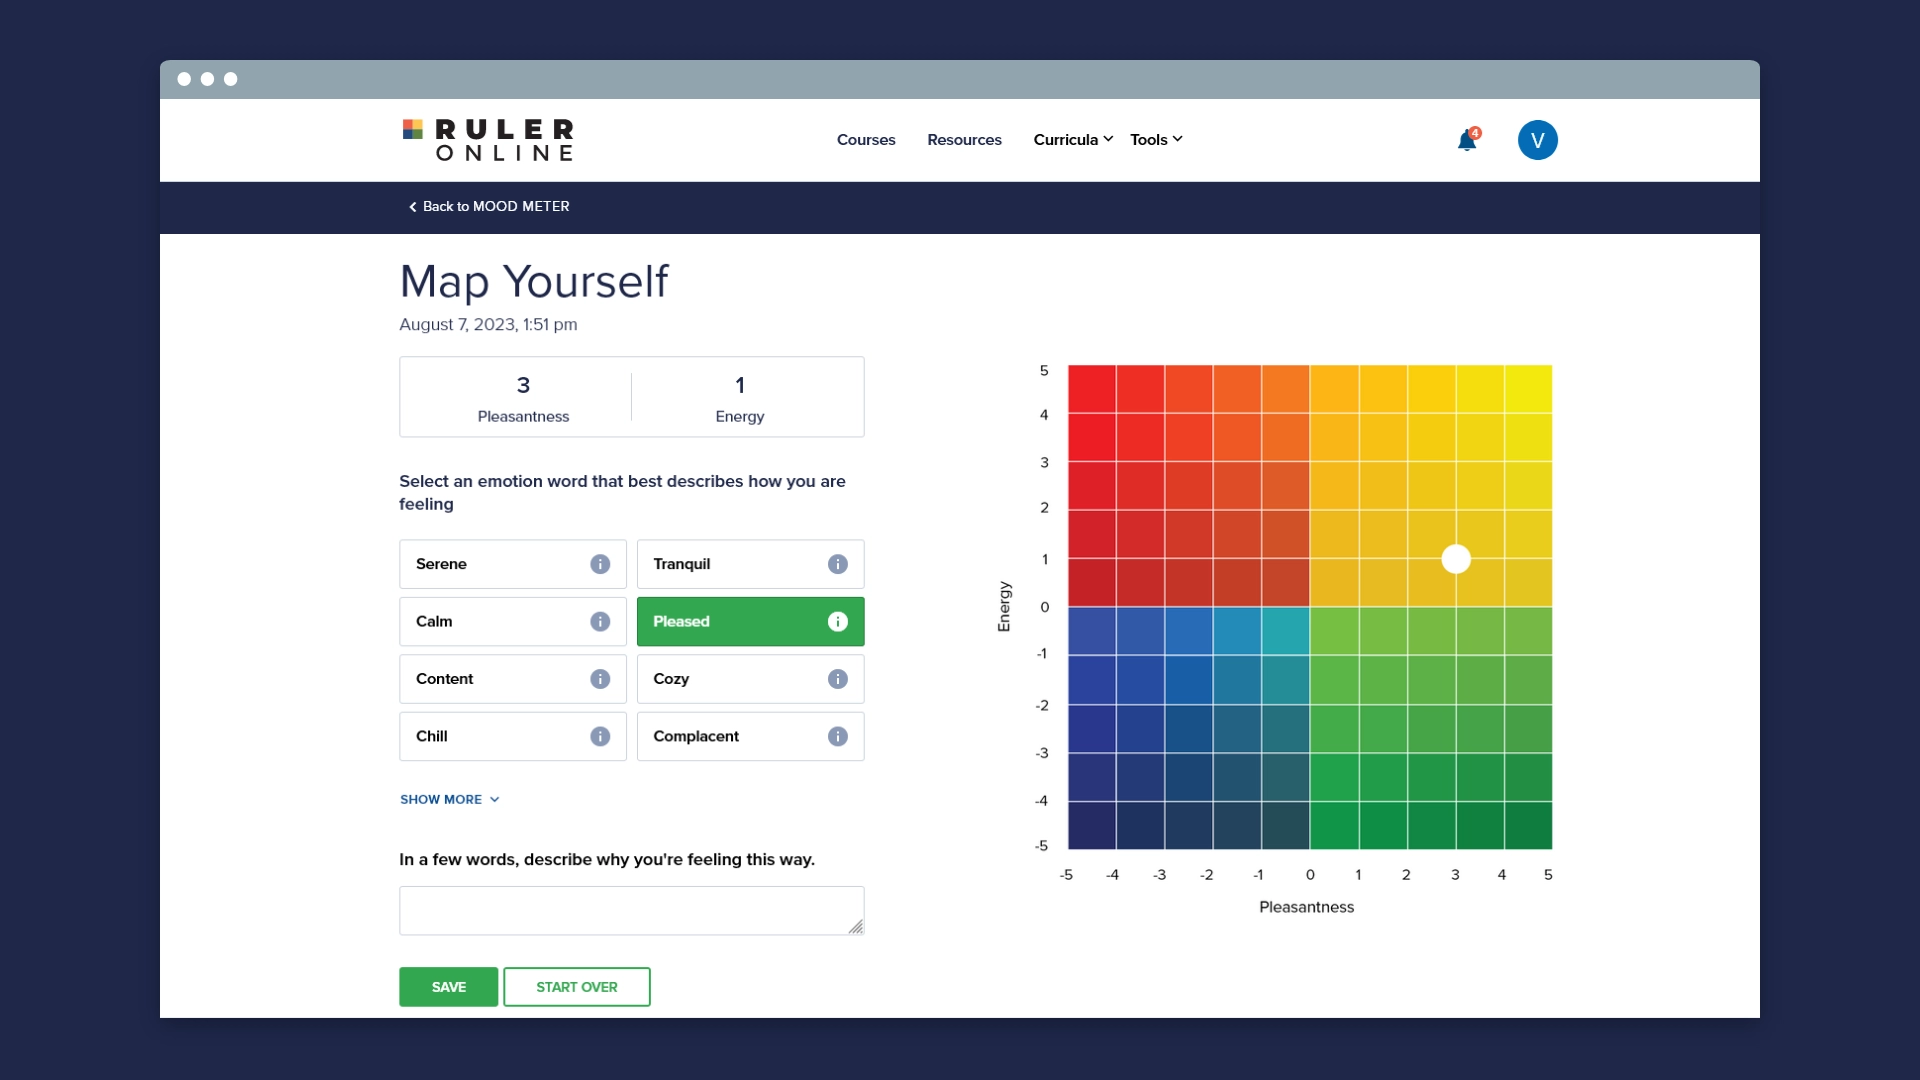
Back to the drawing board
So we went back to the drawing board and asked ourselves: How users can see that moving sliders affect mood meter map? We decided to integrate sliders into the mood meter which looked more natural and intuitive to use. This way the users could plot their mood quicker and with minimum hesitation.
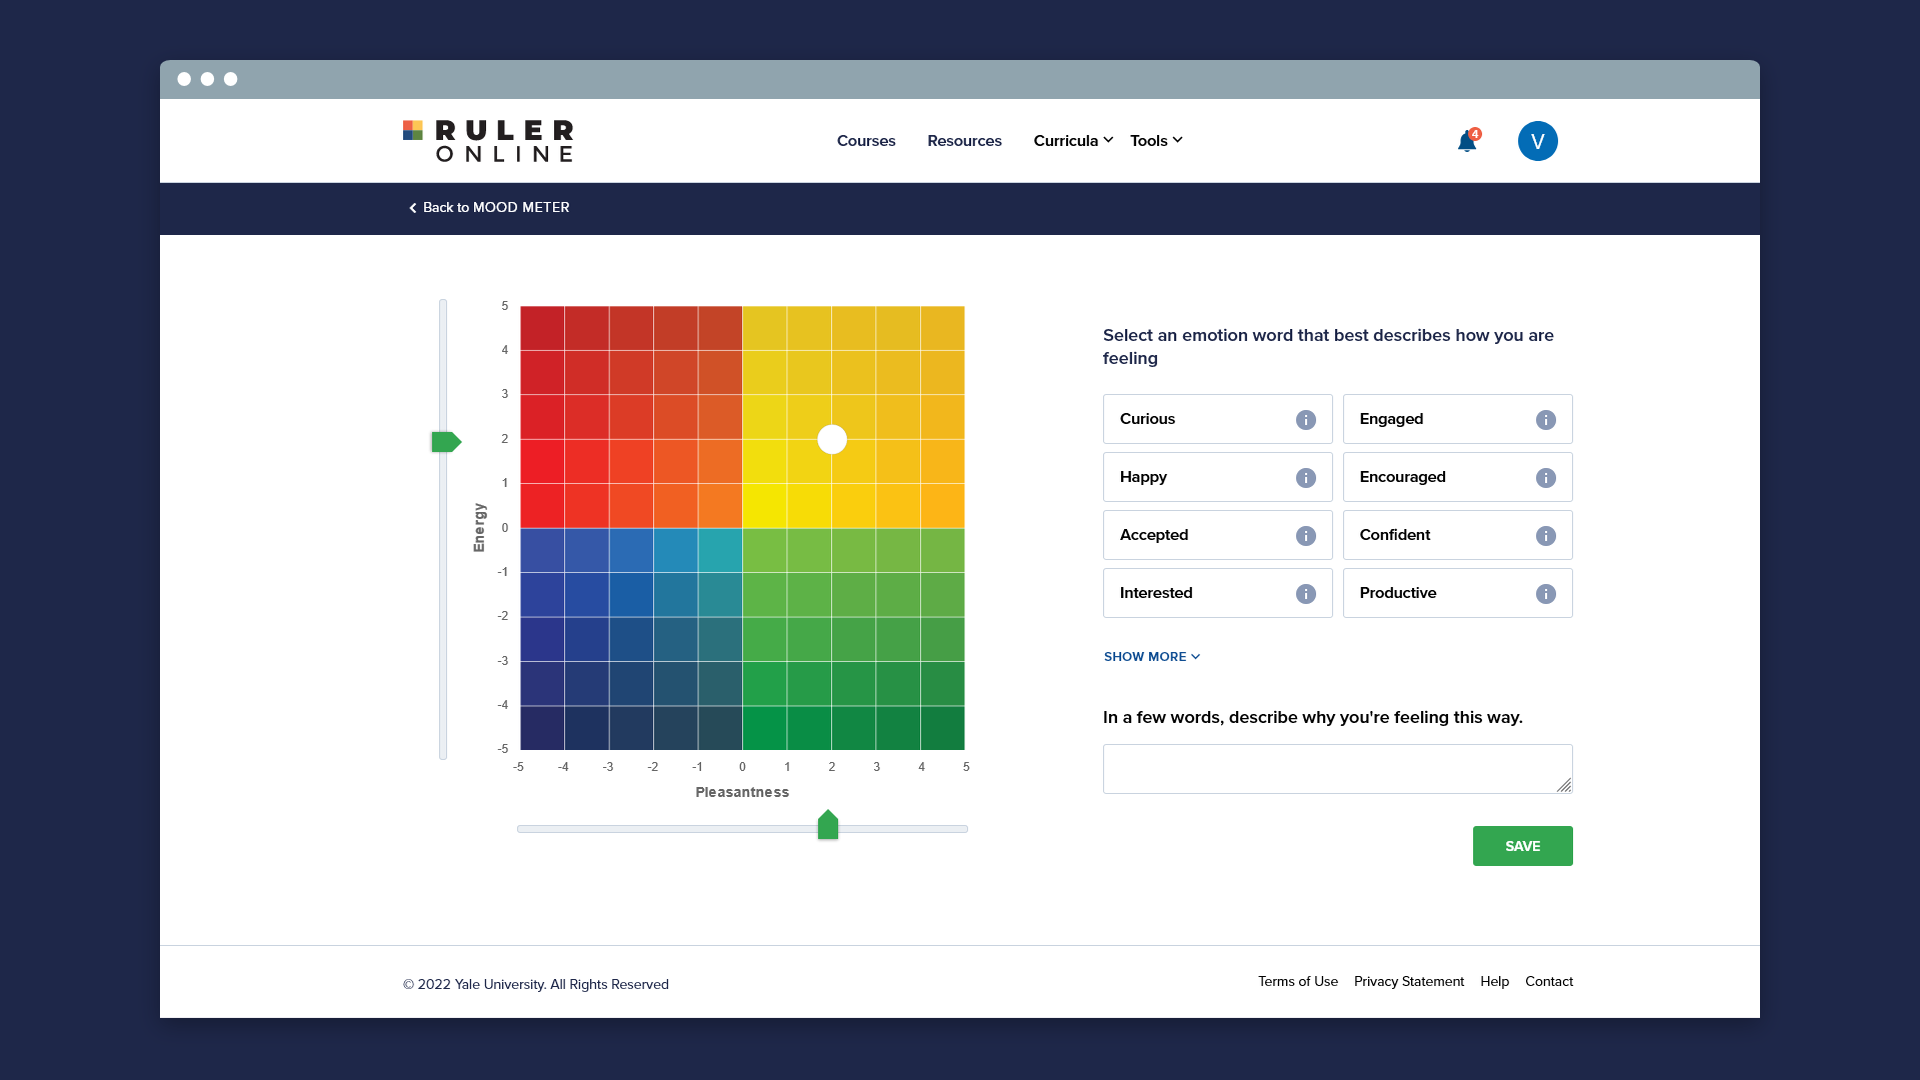
Next Steps
The next step was to allow users to view personal reports to track their feelings. We've added date filter explore their feelings at different times in their life.
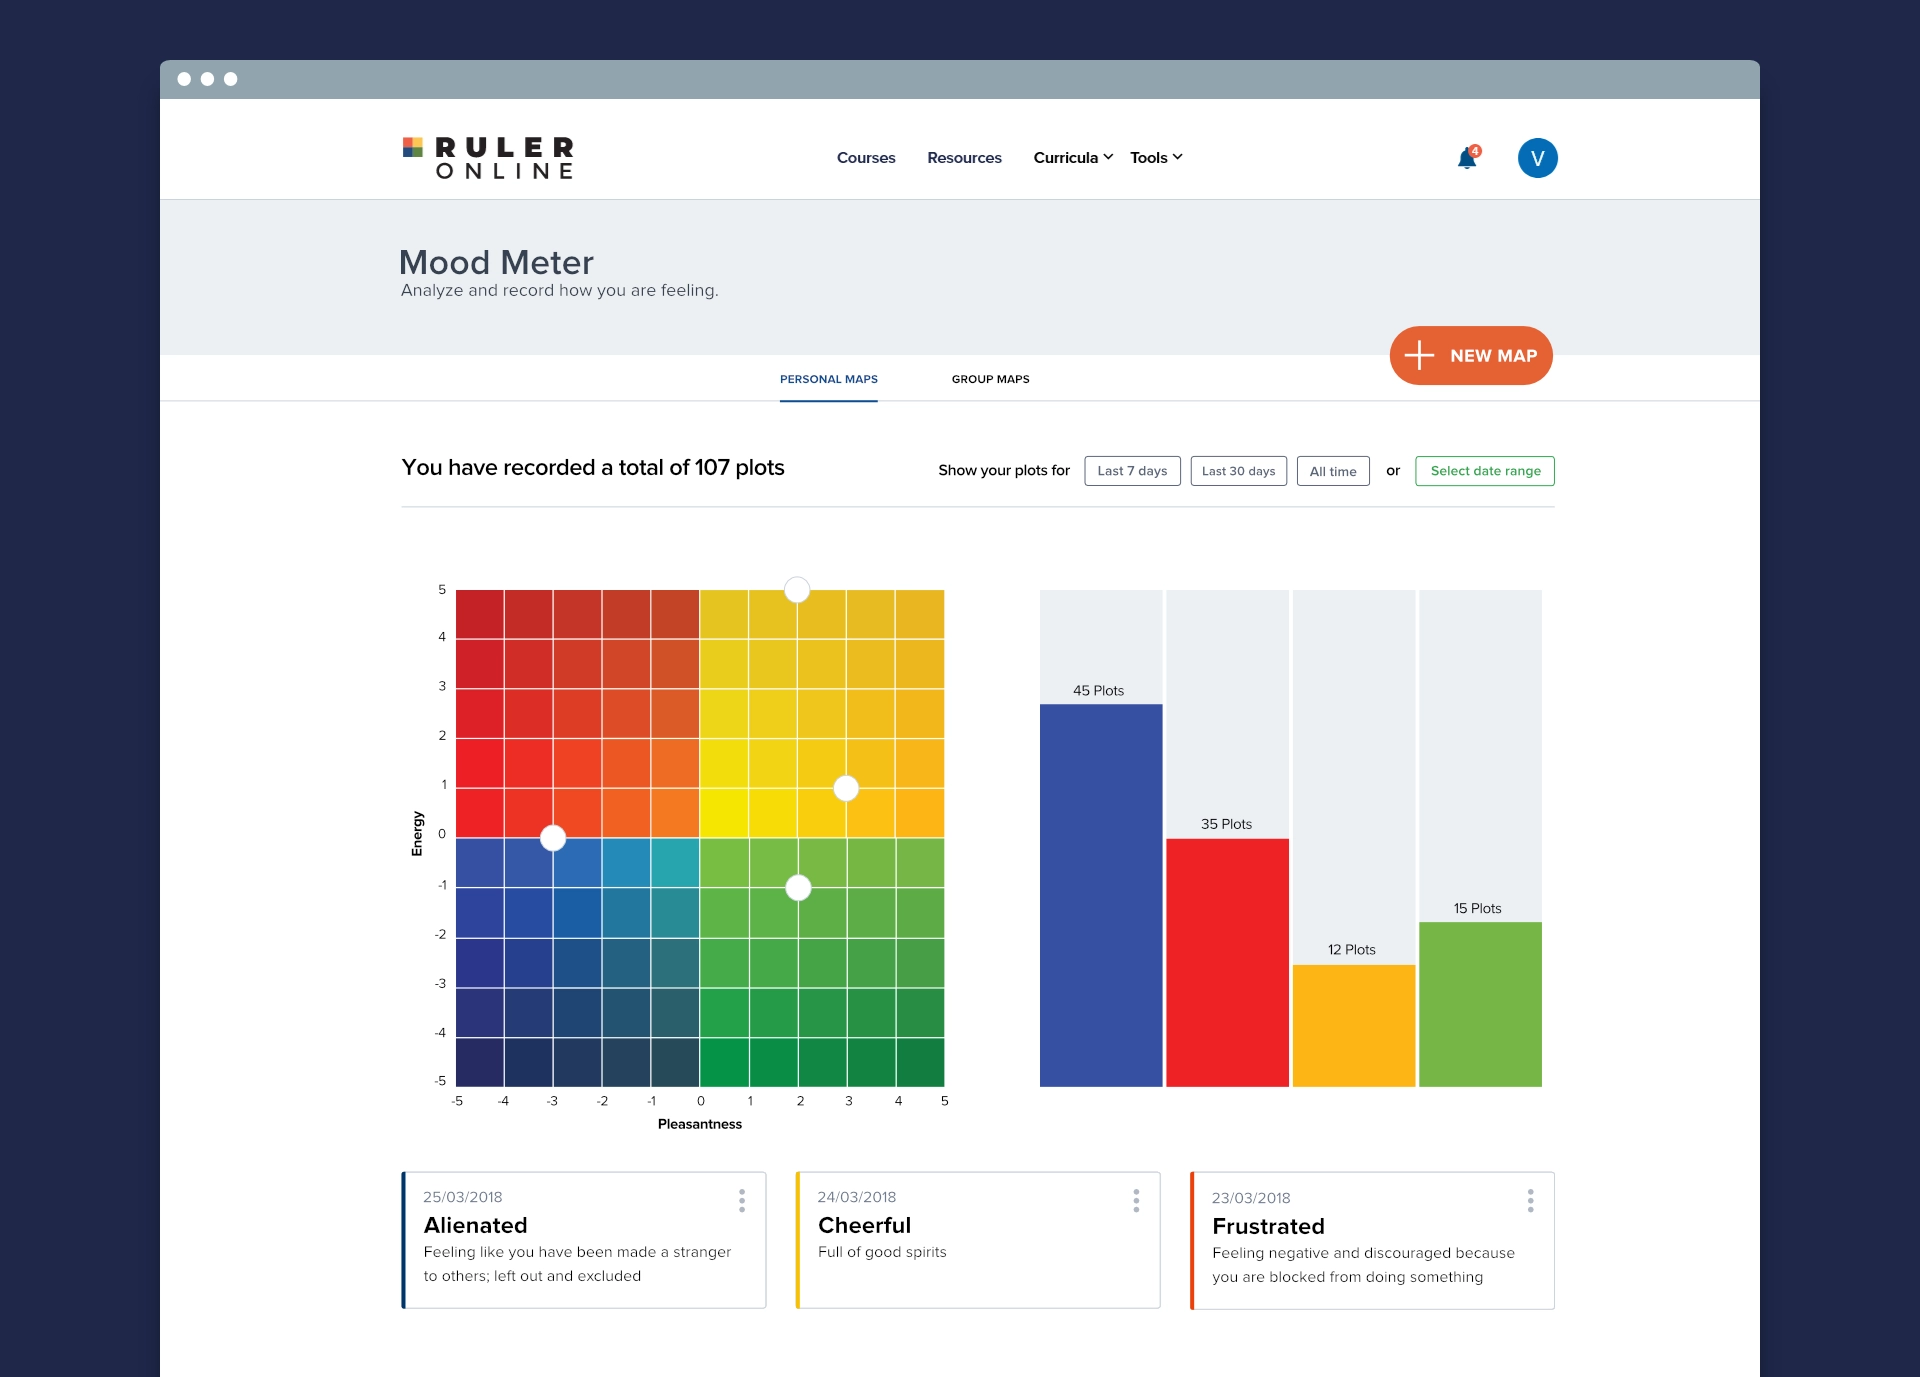
We added also a feature that allows to check the mood of group of people (i.e., in class, grade, staff…).

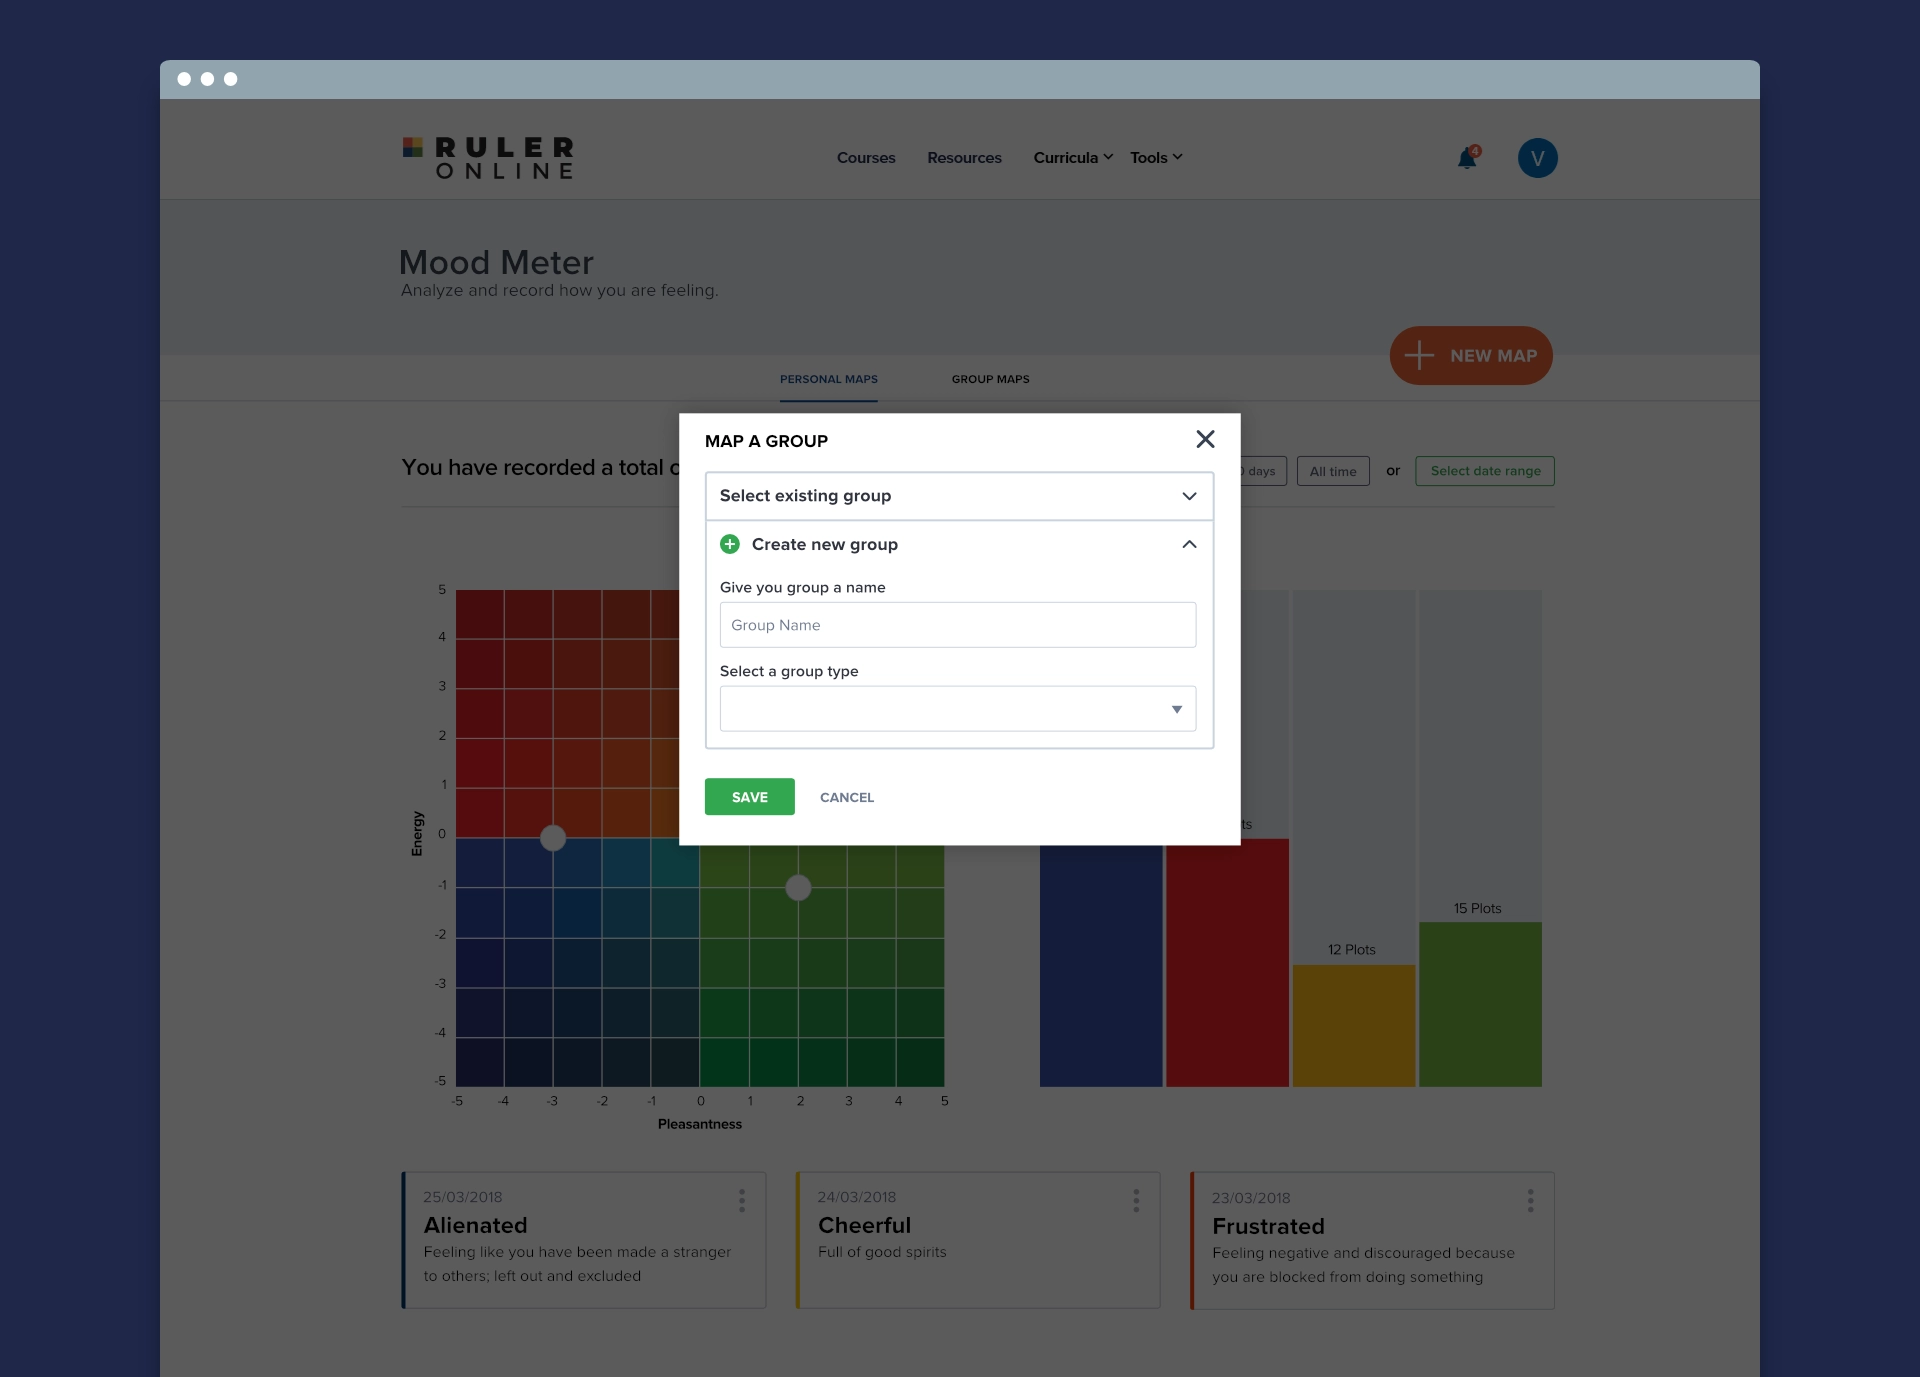
Conclusion
The RULER platform was successful and currently it’s integrated in more than 5000 schools in US and across the world.
The project had many challenges, but the most difficult piece was learning to work with ambiguity. Designing something that wasn’t done before is not the easiest task, but it presents an opportunity to open the door for unexplored solutions.